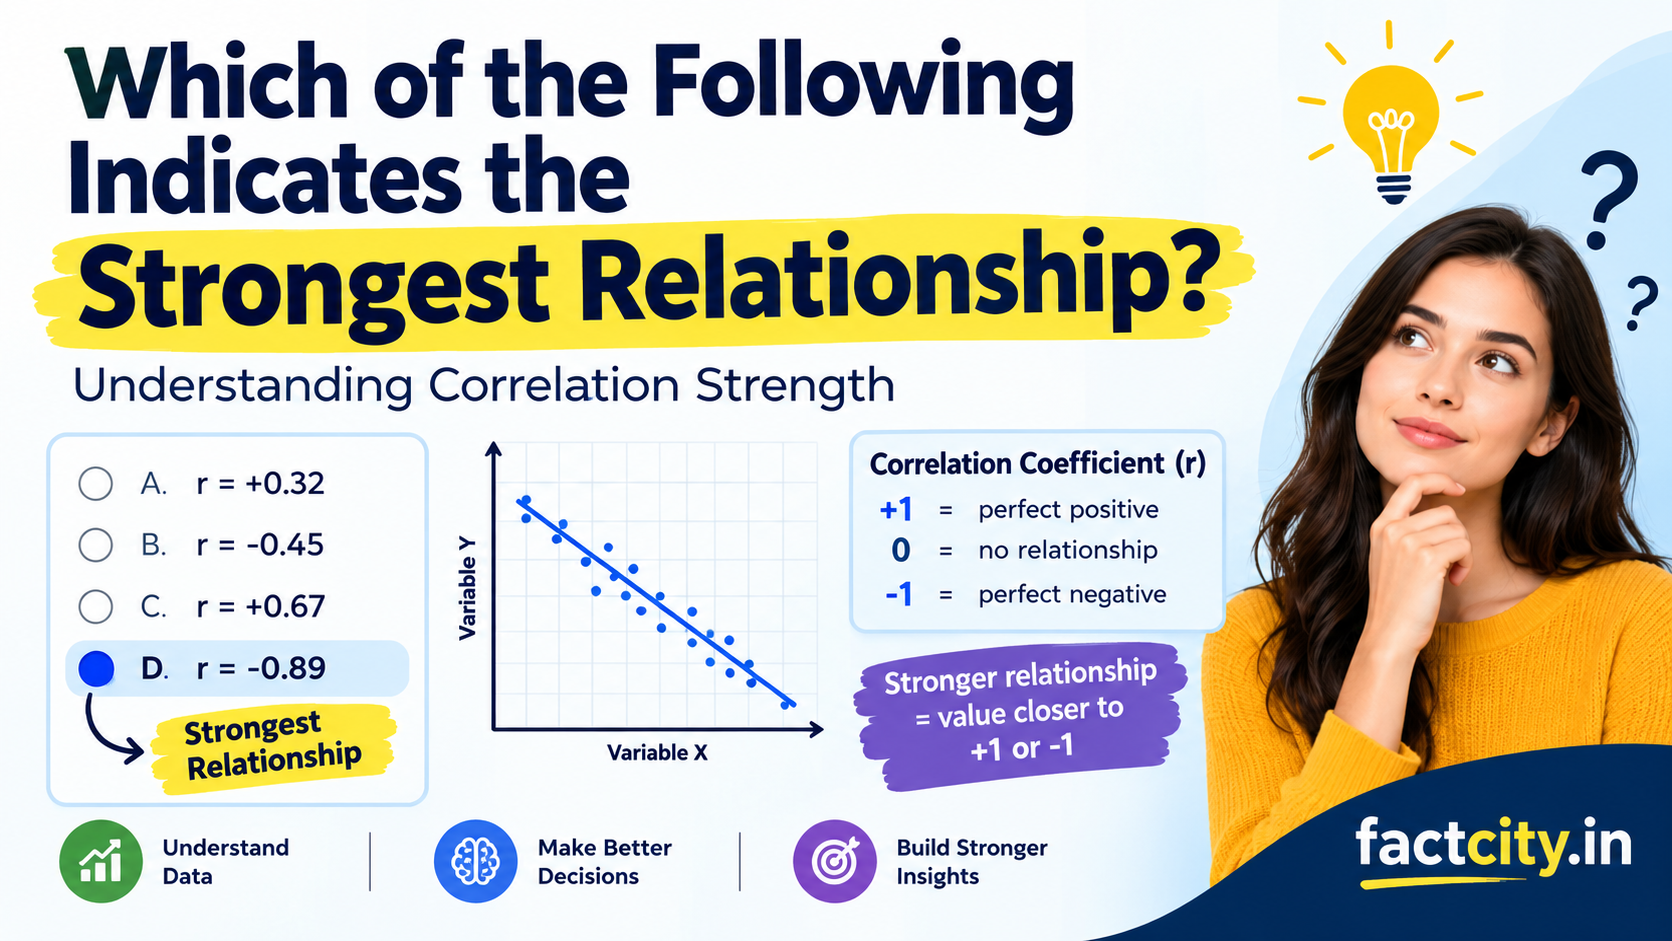
Which of the Following Indicates the Strongest Relationship? In studying statistics, research, psychology, business, economics, or science, you may be asked the question: “Which of the following represents the strongest relationship? The usual question is about the strength of a relationship between two variables. Interpreting data and making informed conclusions depends heavily on understanding the relationship between variables.
In statistics, a correlation coefficient is often used to measure relationships. A correlation coefficient tells us how strongly two variables move together, and whether the relationship is positive or negative. It’s usually between –1 and +1. The correlation coefficient is any number between -1 and +1; the closer to either -1 or +1, the stronger the relationship. A value near zero indicates a weak or no linear relationship.
What Is a Healthy Relationship Like?
If the relationship between two variables is strong, then changes in one variable are related to changes in the other variable. For example, say a researcher looks at the connection between hours of studying and exam scores. Suppose students who study more hours tend to get higher scores; there might be a strong positive relationship between the two variables. But don’t confuse the strength of a relationship with causality. Correlation does not equal causation. Just because two variables are highly correlated doesn’t mean one causes the other.
For example, warm weather might increase ice cream sales, but also swimming activity. This can happen when these variables are influenced by that other variable. For example, temperature.
What is a correlation coefficient?
The correlation coefficient is a number which measures the direction and strength of a linear relationship between two variables. interesting-historical-facts-you-probably-never-knew
The most frequently mentioned correlation coefficient is Pearson’s correlation coefficient, usually denoted by the letter r.
It has values ranging from:
+1 = perfect positive correlation
0 = no linear relation-1 = a perfect negative relationship
Note that strength is not indicated by whether the number is positive or negative, but by how close it is to 1 or -1.
What Correlation Has the Strongest Relationship?
Among several correlation coefficients, the one with the largest absolute value shows the strongest linear relationship.
For example, these options include:
r = +0.25 r = -0.48 r = +0.72 r = -0.91
The strongest is r=-0.91.
Why ? We are comparing absolute values, so
|+0.25| = 0.25 |-0.48| = 0.48 |+0.72| = 0.72 |-0.91| = 0.91
0.91 is closest to 1, indicating the strongest relationship.
The negative sign does not reduce the relationship. It tells us the direction of the relationship.
Positive Relationships vs Negative Relationships
If the correlation is positive, then as one variable goes up, so does the other. When one variable goes up, the other variable also tends to go up.
For example, there might be a positive relationship between:
Study time → Performance on test
In many situations, students who prepare more may obtain higher scores on an exam.
A negative correlation is when the variables tend to go in opposite directions. If one variable goes up, the other tends to go down.
For instance:
Price of product → Demand for product
In a normal economic environment, if the price of a product increases, then the quantity demanded may fall.
Positive and negative correlations can be powerful.
For example, +0.90 and -0.90 have the same strength, but opposite directions.
Correlation Values Strength
Exact interpretations may depend on the field, but correlation values are often roughly described as follows:
Relationship is Very Weak
If the correlation is close to zero, such as 0.05 or -0.10, it usually means there is very little linear relationship. This means that, given one of the variables, we know quite little about the other in terms of a linear pattern.
Poor Relationship
Values such as +0.20 or -0.30 suggest a relatively weak relationship. They are not closely following each other, but there might be some association.
Medium link
A coefficient of + 0.50 or – 0.60 indicates a moderate relationship.
There is still a lot of variation, but the variables have a clear pattern.
Healthy Relationship
Generally, coefficients such as +0.80 or -0.85 are seen as a strong relationship. When one variable is changed, the other tends to change in a similar way.
Very Strong Tie
Values near +1 or -1 (e.g., +0.95 or -0.98) indicate a very strong linear relationship. If the coefficient is +1 or -1, it means a perfect linear relationship.
Why the Absolute Value Counts
The most important thing to remember when answering the question “Which of the following indicates the strongest relationship?” is that the sign and magnitude mean different things. The sign tells you where it is. The absolute value tells you the size.
For example, suppose:
+0.40, -0.60, +0.75
-0.88
The strongest relationship is -0.88, as the absolute value of -0.88 is 0.88, which is greater than 0.75, 0.60, and 0.40.
Therefore, you should not automatically select the biggest positive number. And a large negative correlation is just as strong as a large positive correlation.
Sample Question
Consider this question:
The strongest relationship between two variables is indicated by:
A. r = +0.67 B. r = -0.89 C. r = +0.32 D. r = -0.45
The right answer is:
D. r = − 0.89
This is because |-0.89| = 0.89, which is the largest magnitude among the options.
This suggests a very strong negative linear relationship. The pattern is rather linear in that as one of the variables increases, the other tends to decrease.
Does a Strong Correlation Prove Causation?
No. This is an important idea in statistics. Correlation indicates a relationship between variables, but it does not prove that one variable causes another. Imagine scientists finding that people who carry umbrellas are more likely to encounter wet streets. You are carrying an umbrella; therefore, the street is not wet. Instead, rain impacts both events. That’s why researchers should consider other variables, study design, and other evidence when making causal claims.
Correlation is not causation.
- The difference is easily explained:
- Correlation: A relationship between two variables.
- Causation: A change in one variable results in a change in another variable.
- Such strong correlations can be useful for pattern-finding, prediction, and research question development. But often more evidence is needed to establish cause and effect.
What Does a Correlation Near Zero Mean?
A correlation close to zero usually indicates that there is little or no linear relationship between the variables. If the correlation is r = 0.03, for example, then there is virtually no linear association between the two variables. But that does not necessarily mean that the variables have no relationship whatever. Even when a nonlinear relationship exists, Pearson’s correlation can be close to zero. So researchers will often look at graphs and other statistical measures rather than just one number.
How to Quickly Find the Strongest Relationship
If you’re doing a multiple-choice statistics question, there’s a simple way to do it.
Step 1: Compute the Correlation Coefficients
Look for values represented by r or some other measure of correlation, depending on the question.
Step 2: Forget the Signs for the Moment
Take the absolute value of the coefficients
Step 3: Compare the numbers
The one with the coefficient closest to 1 (in absolute value) has the strongest relationship.
Step 4: Verify the Direction
Once you find the strongest relation, check the sign.
A positive sign means a positive relationship.
A negative sign means a negative relationship.
This approach makes many questions of correlation simple.
Mistakes to Watch Out For
It is a common error to think that the largest positive number always represents the strongest correlation.
For instance, some students might prefer +0.80 to –0.95 because 0.80 is positive. But this is wrong when the question is about strength.
The right comparison is:
|+0.80| = 0.80 |-0.95| = 0.95
Thus, -0.95 indicates the stronger relationship.
Another misconception is that negative correlation is always weak. A negative correlation may be very strong when its value is near -1.
Frequently Asked Questions
What is the strongest correlation?
A correlation with an absolute value close to 1 shows the strongest linear relationship. For example, -0.97 is greater than +0.75.
So, is -0.90 stronger than +0.80?
Sure. -0.90 is stronger because its absolute value is 0.90 compared with 0.80.
What does a +1 correlation indicate?
A correlation of +1 is a perfect positive linear relationship. As one variable increases, the other increases in a perfectly consistent pattern.
What does a correlation of -1 mean?
-1 is a perfect negative linear relationship. The two variables are perfectly linearly correlated, with one rising as the other falls. Always zero correlation means two variables are not related? Naw. A correlation of zero indicates the absence of a linear relationship measured by that correlation. There might be another sort of relationship.
Final Answer: Which Has the Strongest Relationship?
When you read the question “Which of the following indicates the strongest relationship?” remember one simple rule: Choose the correlation coefficient with the largest absolute value or the one nearest +1 or – 1. For example, if the choices are +0.30, -0.55, +0.78, and -0.92, the strongest relationship is -0.92
The negative sign tells us that the relationship is the other way around. The value 0.92 tells us the relationship is very strong . This difference between direction and strength is one of the most useful ideas in basic statistics. If you remember to look at absolute values, then questions about the strongest relationship are much easier to answer.